Hi FME’ers,
Last week I posted about the updates to FME’s Python support in FME2012, so this time out I will try and show an example of what can be done with the technology.
This example integrates FME with a mapping toolkit called Mapnik.
Mapnik is one of our favourite toolkits at Safe Software and both Dale and I have wanted to try an integration for a long time. So, needing a good Python example I took the plunge.
But hopefully this post will show not just how FME can interface with Mapnik, but also demonstrate some of the new functionality in 2012 and how easy it can be to use Python within FME.
NB:As of 2014 there is aMapnikRasterizertransformer built into FME Workbench directly, so there’s no need to follow this example or use Python to get the benefits of Mapnik in FME.
What is Mapnik?
OK, Mapnik is essentially a toolkit for taking in plain spatial data, and rendering it into a genuinely beautiful raster map. Very precise control of symbology is provided by a set of rules that can be defined within a script or within an XML file.
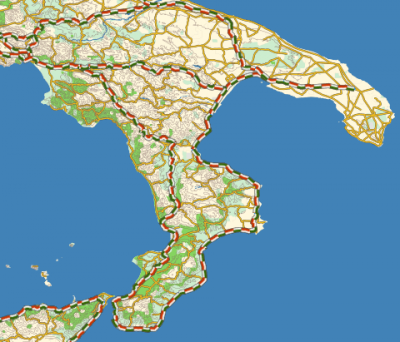
This screenshot (click to enlarge) is copied fromtheir websiteand shows an example of a Vmap dataset rendered with Mapnik:
The most likely use case for FME’ers is to have a Mapnik transformer that takes vector features and renders them as a raster output. FME can do that already, with the ImageRasterizer transformer, but not with anywhere near the elegance of Mapnik. Similarly, Mapnik can read and write different data types, but doesn’t have anywhere near the same format reach that FME does.
And fortunately, though it is written in C++, Mapnik has Python bindings to let us amateur hackers make use of it more easily.
Mapnik and FME Installation
When I created this example I was using a version of Mapnik that is now out of date (v0.7.1). The newest release is version 2.0, but I think this is still a good illustration.
On downoading Mapnik the first point I noticed is that it requires Python v1.6 to operate; FME uses v1.7 by default. So, the first task was to install Python v1.6 and connect FME to it. A bit of trial and error found that Mapnik needs a 32-bit version of Python (and – by the way – that means we’re restricted to 32-bit FME too).
Getting FME to use that Python installation is a breeze in FME2012. That’s because there is a new option under Tools > FME Options to point to the correct DLL. There are a number of locations that Python might get installed (this FMEpedia pageexplains) but in my case (32-bit Python, 64-bit Windows) it is in C:WindowsSysWOW64python26.dll
So now my FME is using that Python interpreter. I then downloaded and installed Mapnik by following their (pretty good) installation guides. In case you get stuck, I had to add two items to the PATH environment variable:
c:mapnik-0.7.1lib c:Python26
From here it gets a bit hazy because I had to do a bit of trial and error to determine how to get features from FME to Mapnik, and this affected what got installed and how.
As mentioned, Mapnik has anumber of format plugins结果最简单的方法(v0.7.1)to convert incoming data to a GeoJSON attribute within FME, and then feed that to Mapnik using the OGR plugin. Since OGR is part of the GDAL library I needed to install that. However, because FME also makes use of this library, I could just point Mapnik to use that.
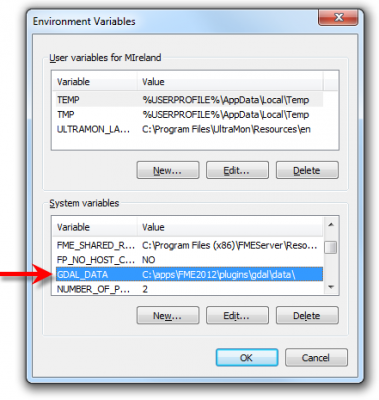
So, to cut a long story short, I simply created a new system variable GDAL_DATA and pointed it to c:appsFME2012pluginsgdaldata (click to enlarge):
Obviously your path might differ depending on OS (and I installed my FME in appsFME2012 because I already have 2011 installed).
FME Workspace
OK, so Mapnik is installed, what does the workspace/script look like?
Well, I’d have liked to create a proper transformer to do the work – you know, using the plugin builder and all – but in the end it was just that bit beyond me. What I did instead was create a script and use a PythonCaller transformer.
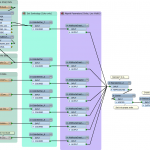
Here’s a screenshot of the workspace itself (click to enlarge):
What I’m doing is just setting up the features by setting their FME colour. But I also set some attributes with Mapnik-related symbology such as line width and display order. I’m only scratching the surface of Mapnik capabilities here; there is much more I could do. I could also put all of this into a lookup file of XML-defined mappings, but I decided for this small demo I would just define symbology manually on the features and use that directly in the script. You’ll see what I mean when I show the script below.
The only other transformers reproject the data to Lat/Long and then sort it into the order I wish to display it in Mapnik. Then the script gets run…
The Python Script
OK. Here’s the script. It won’t win any prizes for elegance, because I’m of an age when the mind is firmly set in BASIC programming mode, but it works.
进口mapnik进口fmeobjects进口__main__ #Get FME Features class MyFeatureProcessor(object): def __init__(self): self.featureList = [] def input(self,feature): # Add to FeatureList self.featureList.append(feature) # Set up map and add FME features as individual layers def close(self): # Extract chosen background colour fmeback = __main__.FME_MacroValues['MapnikBackground'] fmebrgb = fmeback.split(",") mpnkbrgb = 'rgb('+str(int(float(fmebrgb[0])*100))+'%,'+str(int(float(fmebrgb[1])*100))+'%,'+str(int(float(fmebrgb[2])*100))+'%)' # Create Mapnik Map m = mapnik.Map(4000,3500,"+proj=latlong +datum=WGS84") m.background = mapnik.Color(mpnkbrgb) # Create Mapnik Layers/Rules/Styles lyrs = {} ruls = {} styl = {} stylcount = 0 for feature in self.featureList: # Convert geometry to GeoJSON feature.performFunction('@JSONGeometry(TO_ATTRIBUTE,GeoJSON,featGeom)') fmegeom = feature.getAttribute('featGeom') mpnkwid = feature.getAttribute('MapnikLineWidth') # Fetch FME Fill Color fmefill = feature.getAttribute('fme_fill_color') fmefrgb = fmefill.split(",") mpnkfrgb = 'rgb('+str(int(float(fmefrgb[0])*100))+'%,'+str(int(float(fmefrgb[1])*100))+'%,'+str(int(float(fmefrgb[2])*100))+'%)' # Fetch FME Line Color fmeline = feature.getAttribute('fme_color') fmelrgb = fmeline.split(",") mpnklrgb = 'rgb('+str(int(float(fmelrgb[0])*100))+'%,'+str(int(float(fmelrgb[1])*100))+'%,'+str(int(float(fmelrgb[2])*100))+'%)' # Create Mapnik Rule rulsLine = mapnik.LineSymbolizer(mapnik.Color(mpnklrgb),float(mpnkwid)) rulsPoly = mapnik.PolygonSymbolizer(mapnik.Color(mpnkfrgb)) rulsPoint = mapnik.PointSymbolizer("c:FMEInputBusStop.png", "png", 16, 16) ruls[feature] = mapnik.Rule() ruls[feature].symbols.append(rulsPoly) ruls[feature].symbols.append(rulsLine) ruls[feature].symbols.append(rulsPoint) # Create Mapnik Style styl[feature] = mapnik.Style() styl[feature].rules.append(ruls[feature]) m.append_style('My Style'+str(stylcount),styl[feature]) lyrs[feature] = mapnik.Layer('world',"+proj=latlong +datum=WGS84") lyrs[feature].datasource = mapnik.Ogr(file=fmegeom,layer='OGRGeoJSON') lyrs[feature].styles.append('My Style'+str(stylcount)) m.layers.append(lyrs[feature]) stylcount += 1 # Render Mapnik Output m.zoom_all() mapnik.render_to_file(m,'c:FMEOutputParksFromFME.png', 'png')
The Script Explained
Let’s look at how the script works.
Mapnik has a structure of Maps – Layers – Styles – Rules. As it says in theirdocumentation, the Map object is central to the process. That’s easily handled in my script using:
# Create Mapnik Map m = mapnik.Map(4000,3500,"+proj=latlong +datum=WGS84") m.background = mapnik.Color(mpnkbrgb)
Each map can have a number oflayers, each of which has adatasource. Then the layer gets a set of different styles and rules for using them.
Ideally, each layer would match a feature type from FME with a series of styles and rules for each different set of symbology. However, I was a bit worried about whether I could pass a whole layer of data using GeoJSON. So, what I did was to make each FME feature a different layer.
Here I turn the geometry of a feature into GeoJSON:
# Convert geometry to GeoJSON feature.performFunction('@JSONGeometry(TO_ATTRIBUTE,GeoJSON,featGeom)') fmegeom = feature.getAttribute('featGeom')
…and here I create a layer using that GeoJSON geometry as a datasource:
lyrs[feature] = mapnik.Layer('world',"+proj=latlong +datum=WGS84") lyrs[feature].datasource = mapnik.Ogr(file=fmegeom,layer='OGRGeoJSON')
To get the symbology right I fetch the FME symbology, convert it from FME’s RGB (1,1,1) to Mapnik’s RGB (100%,100%,100%)…
FME填充颜色#获取fmefill =有限元分析ture.getAttribute('fme_fill_color') fmefrgb = fmefill.split(",") mpnkfrgb = 'rgb('+str(int(float(fmefrgb[0])*100))+'%,'+str(int(float(fmefrgb[1])*100))+'%,'+str(int(float(fmefrgb[2])*100))+'%)'
[btw, thatmpnkfrgb=line is both beautiful and horrific to me at the same time!]
…create a Mapnik rule from it, create a style using that rule, and append the style to the layer:
#创建Mapnik规则rulsPoly = Mapnik。PolygonSymbolizer(mapnik.Color(mpnkfrgb)) ruls[feature] = mapnik.Rule() ruls[feature].symbols.append(rulsPoly) # Create Mapnik Style styl[feature] = mapnik.Style() styl[feature].rules.append(ruls[feature]) m.append_style('My Style'+str(stylcount),styl[feature]) lyrs[feature].styles.append('My Style'+str(stylcount))
After doing similar for lines and point features, there’s a final line to render the output:
mapnik.render_to_file(m,'c:FMEOutputParksFromFME.png', 'png')
So there’s the Mapnik part. I think the ideal structure would be a Mapnik layer per FME feature type, with a style for each “group” of feature symbology and rules to assign a style to each group.
Dale thinks it would be also useful to define all the symbology in an external XML file. I guess that’s true, in terms of maximum functionality, but I’d much prefer (as an end user) to get a nice transformer dialog in which to define it.
By the way, if I wanted to get the Mapnik output back into Workbench I’d use aRasterReadertransformer after thePythonCallerto do it. Then I would have the ability to rewrite the output using any of the raster formats FME supports; for example I could insert the data into an database like Oracle Georaster or ArcSDE Raster, or write it to a file format like ECW or GeoTIFF.
Function or Class?
The one remaining explanation is how I handle FME features in here.
That’s because normally each feature from FME will trigger the Python script, and that won’t do here because I would get a separate map per feature. Actually the PythonCaller transformer help doc explains the difference between using the PythonCaller as a class or a function.
As a function, the PythonCaller calls the Python function with exactly one argument: an FMEFeature object. The function is called with each FMEFeature that comes into the input port. This feature then continues through the workspace pipeline via the output port.
As a class, the PythonCaller calls two methods: input() and close(). The input() method will be called for each FMEFeature that comes into the input port. When no more FMEFeatures remain, the close() method will be called.
So, take a look at my script. Under the input method I simply add each incoming feature to a feature list, and then the close method finishes up.
def input(self,feature): # Add to FeatureList self.featureList.append(feature) def close(self):
That concludes the “per feature” part of the script. Now I can handle the one-time operations like creating the Mapnik map object, then run through the features again using:
for feature in self.featureList:
Simple….. sort of!
Output
And after I’d finished all this, what did the output look like?
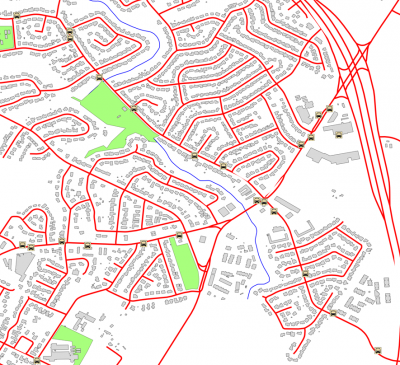
This (click to enlarge):
Maybe not astounding, but I’m very much happy with it! It’s enough to show me how useful it could be with a proper integration.
Well, I think that’s enough of my experiments with Python for now. I hope it is useful in describing some of the things FME can do with Python, and some of the methods you can use.
Look out for an upcoming article on FME Server security updates for 2012, which I expect to be the next post I do.
Regards

Mark Ireland
Mark, aka iMark, is the FME Evangelist (est. 2004) and has a passion for FME Training. He likes being able to help people understand and use technology in new and interesting ways. One of his other passions is football (aka. Soccer). He likes both technology and soccer so much that he wrote an article about the two together! Who would’ve thought? (Answer: iMark)